Narda - Safety Test Solutions

IDA 2 combines analog and digital signal analysis methods:

A conventional heterodyne receiver for pre selection is followed by a digital analyzer for fine selection and further processing. The received signal is mixed down to a base band (zero span) after pre selection, frequency conversion, and A/D conversion, splitting it into its real (in phase) and imaginary (quadrature) components.

The I/Q data obtained are then available for further evaluations. The original data set is retained, so that changing the settings such as frequency resolution, time period or time resolution for the evaluation does not result in a reduction in the data.

In I/Q Analyzer mode (option), the IDA 2 provides many facilities for evaluation that were previously only available from large laboratory instruments in a much higher price bracket:

I/Q

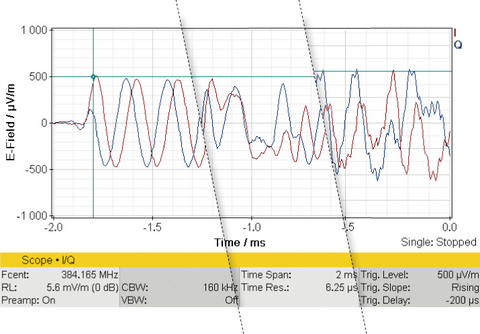
IDA 2 displays the time response of the sampled values in I/Q display mode. Experts can draw conclusions about the modulation type and interference just from the signal shape. Example: sections of I/Q data from a TETRA signal, unmodulated / modulated / modulated and with interference.

The I/Q data also form the basis for further external evaluation on a PC, such as computation of constellation diagrams, for example.

Magnitude

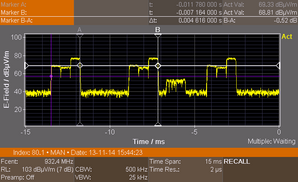
The IDA 2 calculates the magnitude from the I and Q (real and imaginary) components and displays this versus time. A resolution of down to 32 ns is possible for the time scale.

Impulse sequences and pulse durations can be precisely measured at such high resolution. In this way, interference can be correlated to specific wireless services if it shows a particular time structure.

HiRes Spectrogram Full

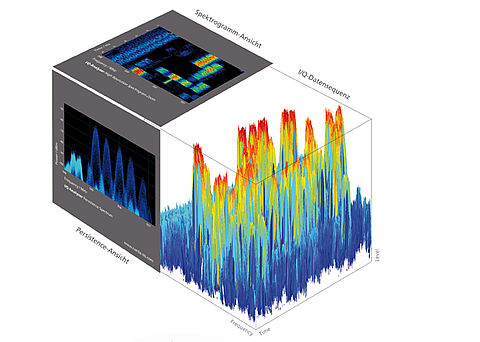
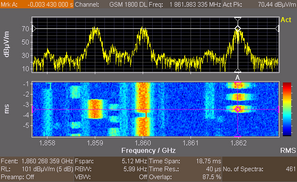
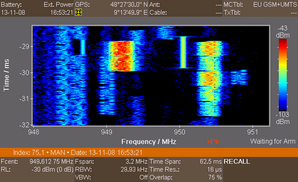
This is a measurement and display without time gaps of consecutive spectrums, where the colors indicate the signal level. This produces a two dimensional image resolved in frequency and time. Each line corresponds to one spectrum. The marker can be used to view it as a "conventional" spectrum.

HiRes Spectrogram Zoom

This is a spectrogram with the highest time resolution allowed by the saved data set. Resolutions of down to 1 µs are possible, depending on the Span (frequency range) and Overlap (FFT window overlap).

Wireless services that make use of frequency hopping can be recognized and correlated by means of the time and frequency display, for example. At the same time, unintentional or deliberate interference that is often easily concealed by the "live" spectrum also becomes visible.

Persistence Spectrum

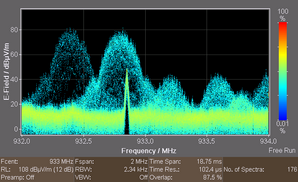
Here, the IDA 2 displays several spectrums as level versus time. The color represents the rate of occurrence of a given level. The display corresponds to the "afterglow" effect of older analyzers.

The persistence spectrum is ideal for detecting signals beneath signals: Permanent interference at a low level is revealed by the fact that the measured level does not drop to the noise floor when the useful signal is absent. For example, in the GSM frequency range, the channel occupancy changes but the underlying interference is stable and is immediately recognizable.